Rung 1 · debug flow answers “did this packet arrive, which policy, SNAT or encrypt?” Rung 2 · session table answers “is the 5-tuple live right now — proto_state + policy_id?” Rung 3 · get router info answers “which FIB / VRF / interface will this dest take?” Rung 4 · diagnose vpn ike answers “is Phase 1 up and Phase 2 accepting traffic?” Rung 5 · FortiView is the GUI show-back (and End Session), not the first isolate tool. You stop climbing when a field lights up. You stop debug before you leave the bridge.
1. Why a ladder, not a dump
The evidence desk taught you to pick one first instrument — session, flow, or Log & Report — for five different tickets. This page is the Sev-1 bridge. One transaction. One change window in the last hour. Five rungs you climb in a fixed order until a field names the owner.
Concept: a ladder is a sequence of questions, not a bag of commands. Path: write user + 5-tuple + UTC + VDOM + HA role, then climb. Do: close the VIP-timeout ticket below without adding policy 15 and without leaving debug enabled.
Fortinet documents that if the FortiGate is connected to FortiAnalyzer or FortiCloud, diagnose debug flow output is recorded as event log messages. Do not run it longer than necessary. Unfiltered flow, unfiltered diagnose sys session clear, diagnose vpn tunnel flush with no name, and leaving diagnose debug application ike -1 enabled are forbidden on this ladder. Confirm VDOM. An empty table on the standby is not a missing policy.
If they say “the portal is down, fix FortiGate,” do not say “I opened Policy & Objects.” Say: “I prove the packet with filtered debug flow, the live tuple with proto_state, the next hop with get router info routing-table details, the overlay with diagnose vpn ike gateway list, and I show the same 5-tuple back on FortiView Sessions. I change nothing until that field is in the ticket.”
2. Mental model — five rungs
Pre-train the five words before you type. Each rung is allowed one claim. Over-claiming a field is how you ship a bad static route at 02:00.
1 · diagnose debug flow
This packet. Official: Debugging the packet flow. Filter, enable, trace start <N>, stop. Proof: received a packet, allocate a new session, find a route, Allowed by Policy-N: SNAT or encrypt.
2 · diagnose sys session
Live now. Official: Using a session table. filter then list. Proof: proto_state, policy_id, orig/reply tuple, NAT hooks, npu_state.
3 · get router info
Where it should go. Official: Routing concepts. routing-table details <dest> inside the VDOM. Proof: Known via, best, via interface / tunnel, VRF.
4 · diagnose vpn ike
Is the overlay up. Official: IPsec related diagnose commands. Phase 1 = ike gateway list. Phase 2 = vpn tunnel list. Proof: status=up, accept_traffic, DPD status=ok.
5 · FortiView
GUI show-back. Official: FortiView Sessions. Path: Dashboard → FortiView → Sessions. Top sessions by source. Can end a session. Drill Down to Details. Not the first isolate tool.
Hard words, once
proto_state 01 = SYN seen, not established. 11 = the established pair. FIB = kernel forwarding table (get router info kernel). database = all learned routes before selection. NP offload = flow cannot see the session.
Read left → right. Each box is allowed one claim. If you cannot name the field, you are not proving — you are guessing.
I prove the packet, then the live session, then the next hop, then the IKE SA, then I show the same 5-tuple on FortiView. I do not add an accept, flush every tunnel, or leave flow running because someone is loud.
3. Decision flow — which rung first
Flowchart first. Do not open Policy & Objects until a diamond says the owner is a missing allow — and that is rare on this ladder.
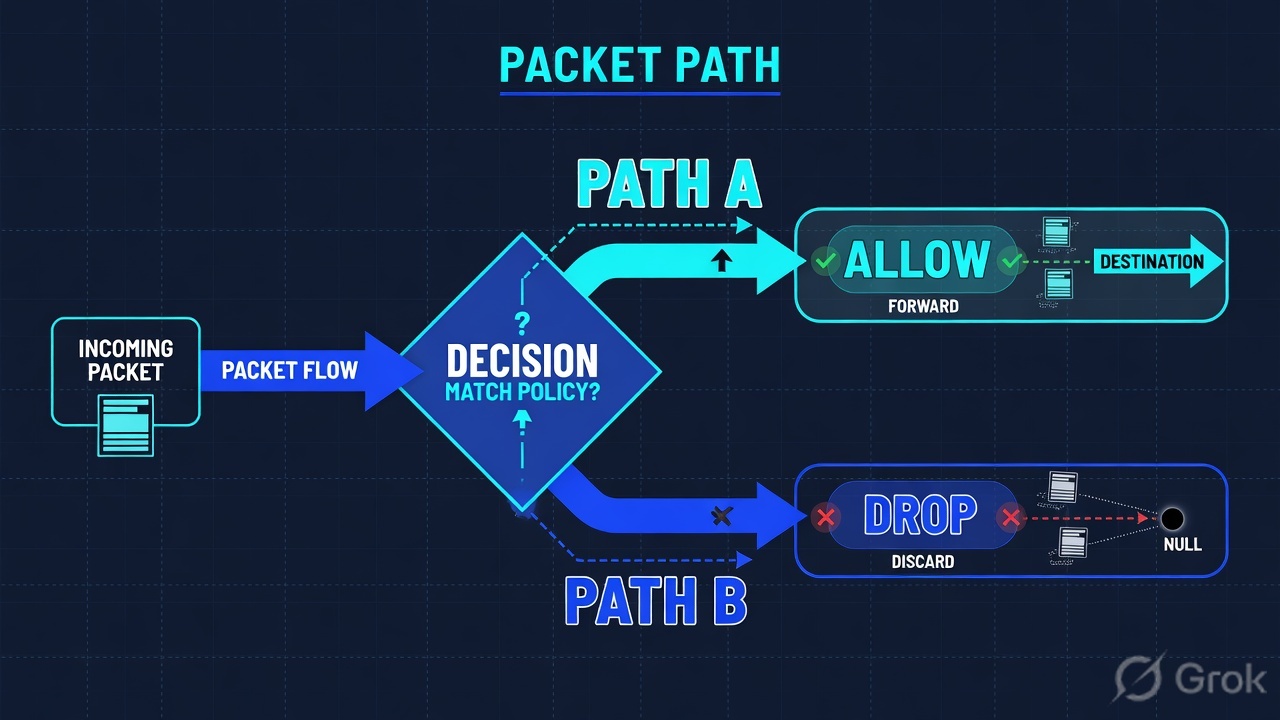
Read the diamond first. A tunnel next hop never starts in Policy & Objects. Allowed + no SYN-ACK never starts as “missing allow.” Empty HTTPS flow never starts as “never arrived” until you have said NP offload out loud.
4. How to choose — rung + proof field
Print this next to the console. If you cannot recite the proof field, you are not ready to change anything.
| If the bridge says… | First rung (official) | Proof field | Do not open first |
|---|---|---|---|
| Policy hits, packet may never have installed a session | diagnose debug flow — filter then trace start N. GUI: Network → Diagnostics → Debug Flow |
received a packet vs silence; Allowed by Policy-N: SNAT or encrypt; find a route |
A new accept policy |
| HTTPS hangs right now; you have src / dst / port | diagnose sys session filter then list |
proto_state + policy_id (+ NAT hook, npu_state) |
Unfiltered session dump |
| Symptom started after a route / SD-WAN / static change | get router info routing-table details <dest> in the VDOM. GUI: Dashboard → Network Monitor → Routing |
Known via + best + via interface / tunnel + VRF |
A second default route |
| Next hop is an IPsec interface, or the branch overlay is dark | diagnose vpn ike gateway list then diagnose vpn tunnel list |
Phase 1 name / version / addr; Phase 2 status=up, accept_traffic, DPD status=ok |
diagnose vpn tunnel flush with no name |
| Need to show the CIO the same 5-tuple, or end one hung session | Dashboard → FortiView → Sessions | Source / dest / policy on the Sessions monitor; End Session on that row only | End Session on every top talker |
Primary sources: Debugging the packet flow + Using the debug flow tool (rung 1). Using a session table (rung 2). Routing concepts + Routing monitor (rung 3). IPsec related diagnose commands (rung 4). FortiView Sessions + Using FortiView (rung 5).
5. Runbook Side A → B → C
Side A isolates the packet and the live session. Side B proves the next hop and the overlay. Side C is the GUI show-back and the stop. On a messy Sev-1, do them in this order until a field lights up.
Side A — Packet + session (rungs 1–2)
Source: Debugging the packet flow; Using the debug flow tool; Using a session table.
-
State VDOM and HA role before any diagnose
get system statusand, if clustered,get system ha status. Fortinet: if VDOMs are enabled, routing-related CLI must run inside the VDOM, not in global. An empty session table on the standby is not a missing policy. -
Arm debug flow — official filter keys, then start N
IPv4:
diagnose debug flow filterwithaddr,saddr,daddr,port,sport,dport,proto,vd(−1 matches all), orclear. IPv6 usesfilter6. Official sequence:diagnose debug enable→ filter →diagnose debug flow show function-name enable→diagnose debug flow trace start 100. GUI: Network → Diagnostics → Debug Flow. Basic = addr / port / proto. Advanced = saddr / sport / daddr / dport / proto. -
Read the official-style lines
HTTP sample (Fortinet):
vd-root received a packet→allocate a new session→find a route: gw-… via portN→Allowed by Policy-3: SNAT. IPsec sample:Allowed by Policy-2: encryptthenenter IPsec tunnel-RemotePhase1. Silence after a reproduce is also evidence — wrong VDOM, packet never arrived, or NP offload. -
Session table — filter is not a list
diagnose sys session filter src 203.0.113.45thendiagnose sys session list. Official filter keys includesrc,dst,dport,proto,proto-state,policy,vd. Quoteproto_state,policy_id, orig-tuple, reply-tuple, NAT hooks,npu_state. TCP01is SYN seen.11is the established pair you want after a fix. -
Stop is part of isolate
diagnose debug flow trace stop, then disable / reset. GUI: Stop debug flow, then Save as CSV if you need the file. Add the Function column (Configure Table) when you wantfw_forward_handlernext to the message. Fortinet: do not run flow longer than necessary.
FGT-LAB # config vdom
FGT-LAB (vdom) # edit root
FGT-LAB (root) # diagnose debug enable
FGT-LAB (root) # diagnose debug flow filter addr 203.0.113.45
FGT-LAB (root) # diagnose debug flow show function-name enable
FGT-LAB (root) # diagnose debug flow trace start 100
id=20085 trace_id=17 func=print_pkt_detail msg="vd-root:0 received a packet(proto=6, 203.0.113.45:51990->198.51.100.80:443) from port2."
id=20085 trace_id=17 func=resolve_ip_tuple msg="allocate a new session-00000e90"
id=20085 trace_id=17 func=vf_ip4_route_input msg="find a route: gw-10.20.0.1 via vpn-hq"
id=20085 trace_id=17 func=fw_forward_handler msg="Allowed by Policy-14: SNAT"
FGT-LAB (root) # diagnose debug flow trace stop
FGT-LAB (root) # diagnose debug disable
FGT-LAB (root) # diagnose debug reset
FGT-LAB (root) # diagnose sys session filter src 203.0.113.45
FGT-LAB (root) # diagnose sys session list
session info: proto=6 proto_state=01 duration=48 expire=3552 timeout=3600
  orig-tuple: 203.0.113.45:51990 -> 198.51.100.80:443
  reply-tuple: 198.51.100.80:443 -> 192.0.2.20:18422
  hook=post dir=org act=snat 203.0.113.45:51990->192.0.2.20:18422
  policy_id=14 pol_idx=0
  npu_state=00000000
  total: 1 session listed
Proof fields: flow Allowed by Policy-14: SNAT + find a route … via vpn-hq; session proto_state=01 with policy_id=14. Policy already accepts. Handshake never finished. Next hop is a tunnel — climb Side B. Source: Debugging the packet flow (sample “Allowed by Policy-3: SNAT”); Using a session table.
Network → Diagnostics → Debug Flow · VDOM root
Debug Flow
received a packet(proto=6, 203.0.113.45:51990->198.51.100.80:443) from port2
allocate a new session-00000e90
find a route: gw-10.20.0.1 via vpn-hq
Allowed by Policy-14: SNAT
Source: FortiOS Administration Guide 8.0.0 — Using the debug flow tool. Path: Network → Diagnostics → Debug Flow. Advanced fields map 1:1 to saddr / sport / daddr / dport / proto. Next click after the reproduce: Stop debug flow. Lab addresses (RFC 5737) only. Training mock · not live.
Flow monitoring does not work for traffic offloaded to NP6 or NP7 processors. Official workarounds: test with ICMP (ICMP is not offloaded) or temporarily disable NP offloading. NP6: diagnose npu {np6 | np6xlite | np6lite} fastpath disable. NP7: disable offloading in the firewall policy that accepts the traffic you are tracing, or use the NP7 packet sniffer. Do not treat a blank HTTPS trace as “never arrived” until you have checked npu_state.
Side B — Next hop + overlay (rungs 3–4)
Source: Routing concepts; Routing monitor; IPsec related diagnose commands.
-
Look up this destination — do not dump the whole table first
Inside the VDOM:
get router info routing-table details 198.51.100.80. Official CLI look-up tool. QuoteRouting table for VRF=,Known via(static / OSPF / BGP / connected),best, and the via interface. GUI twin: Dashboard → Network Monitor → Routing. Route look-up fields: Destination, Destination Port, Source, Protocol, Source Interface — click Search; the matching route is highlighted. -
If two protocols learned the same dest, open the database
get router info routing-table databaselists learned routes before injection. Selected routes are marked>. The FIB that actually forwards isget router info kernel. A route in the database that is not selected is not the hop the packet takes. -
If the via interface is IPsec, climb to IKE — do not flush yet
Phase 1:
diagnose vpn ike gateway list(anddiagnose vpn ike statusfor daemon totals). Official fields includevd,name,version,interface,addr(local:port → peer:port),peer-id,DPD sent/recv, lifetime/rekey. Phase 2:diagnose vpn tunnel list— quotename=,status=up,accept_traffic,dpd: … status=ok,proxyidselectors,dec:pkts/bytes/enc:pkts/bytes. -
IKE debug is isolate, not a fix
Official pair:
diagnose vpn ike log filter rem-addr4 <peer>(andloc-addr4) thendiagnose debug application ike -1+diagnose debug enable. Reproduce one negotiation. Then disable and reset. Flush is change-control:diagnose vpn tunnel flush <name>flushes that Phase 2 SA. Barediagnose vpn tunnel flushflushes all Phase 2 SAs in the VDOM. Do not do that on a war-room bridge without a named blast radius.
FGT-LAB (root) # get router info routing-table details 198.51.100.80
Routing table for VRF=0
Routing entry for 198.51.100.0/24
  Known via "static", distance 10, metric 0, best
  * 10.20.0.1, via vpn-hq

FGT-LAB (root) # diagnose vpn ike gateway list
vd: root/0
name: vpn-hq
version: 2
interface: wan1 5
addr: 192.0.2.1:500 -> 198.51.100.1:500
peer-id: 198.51.100.1
  DPD sent/recv: 00000012/00000012
  lifetime/rekey: 86400/84366

FGT-LAB (root) # diagnose vpn tunnel list
name=vpn-hq ver=2 serial=3 192.0.2.1:0->198.51.100.1:0 tun_id=10.20.0.1
status=up dst_mtu=1500
accept_traffic=1
dpd: mode=on-demand on=1 status=ok idle=20000ms retry=3 count=0
proxyid=vpn-hq proto=0 sa=1
  src: 0:10.10.20.0-10.10.20.255:0
  dst: 0:198.51.100.0-198.51.100.255:0
  dec:pkts/bytes=12/980
  enc:pkts/bytes=48/6120
Proof fields: Known via "static" … via vpn-hq; IKE version: 2 + DPD counters; tunnel status=up, accept_traffic=1, DPD status=ok. Selectors must cover the 5-tuple. Source: Routing concepts (details 4.4.4.4 sample); IPsec related diagnose commands.
diagnose vpn ike gateway list is the Phase 1 SA (IKE). diagnose vpn tunnel list is the Phase 2 IPsec SA (selectors, SPI, enc/dec counters). A green Phase 1 with accept_traffic=0 or a selector that does not cover 198.51.100.80/443 is still a failed overlay. get vpn ipsec tunnel summary and get vpn ike gateway are the shorter siblings Fortinet lists on the same page.
Side C — FortiView show-back + close (rung 5)
Source: FortiView Sessions; Using FortiView; Routing monitor (Network Monitor dashboard).
-
Open FortiView Sessions, not Policy & Objects
Path: Dashboard → FortiView → Sessions. Official: the Sessions monitor displays Top Sessions by traffic source and can be used to end sessions. Filter or find the same src you used on the CLI. This is show-back for the bridge — it is not a substitute for
proto_state. -
Drill Down to Details, then End Session only if that is the change
Official: double-click or right-click an entry and select Drill Down to Details. End Session on that one 5-tuple if the hung state is the problem. Ending every top talker is a user-impacting change you did not get approved.
-
Routing and VPN monitors are twins, not new owners
Dashboard → Network Monitor → Routing is the GUI twin of
get router info routing-table(dropdown Policy for policy routes). Dashboard → Security → VPN monitor is the GUI twin of the IKE / tunnel list. Quote the same dest / tunnel name you already proved on the CLI. -
Retest the original transaction
Same user, same VIP, same 5-tuple. Success on this ladder is
proto_state=11on the intendedpolicy_id, the samedetails <dest>hop you intended, and (if overlay) tunnelstatus=upwith incrementing enc/dec on that proxy-id. Then leave an observation window. A changed static is not a fix until the old failing field is gone.
Dashboard → FortiView → Sessions · VDOM root · now
FortiView Sessions
| Source | Destination | Service | Policy | Bytes | Action |
|---|---|---|---|---|---|
| 203.0.113.45 | 198.51.100.80 | HTTPS | 14 VIP-Portal | 1.2 KB | SYN only |
| 203.0.113.88 | 203.0.113.10 | DNS | 8 LAN-DNS | 84 KB | Established |
Source: FortiOS Administration Guide 8.0.0 — FortiView Sessions (Dashboard → FortiView → Sessions; Top Sessions by traffic source; end sessions). Using FortiView — Drill Down to Details. Lab identities only. Training mock · not live.
- Side A: filtered flow shows
received a packet+Allowed by Policy-N; session list quotesproto_state+policy_id; debug is stopped. - Side B:
details <dest>namesKnown via+ via interface. If that interface is IPsec: gateway list + tunnel list withstatus=up,accept_traffic=1, DPD ok, selectors covering the tuple. - Side C: FortiView Sessions shows the same src / dest / policy. After the fix, CLI
proto_state=11on a retest of the original VIP.
6. Three war-room tickets
These three land on the bridge. Memorise first rung + proof field. Times and identities below are lab-only (RFC 5737).
Policy hit count up — server never sees a complete session
Internet user 203.0.113.45 to VIP 198.51.100.80:443. Change window moved a static an hour ago. Hit counter on policy 14 increments. App team: “no SYN on the real server.”
diagnose debug flow (then session list on the same src)Allowed by Policy-14: SNAT + find a route … via … + proto_state=01If flow says Allowed and session is 01, you do not add policy 15. Climb to get router info routing-table details 198.51.100.80. If via is the old WAN or a blackhole, that is the owner. If via is vpn-hq, climb to IKE. History-only companion: evidence desk Log & Report.
Branch LAN can ping the tunnel IP — CRM over the overlay times out
Pune spoke. Tunnel icon looks up. Users to 10.20.8.40:443 fail. Someone wants diagnose vpn tunnel flush on every name.
get router info routing-table details 10.20.8.40 then diagnose vpn ike gateway list + diagnose vpn tunnel listKnown via + via tunnel name; Phase 2 status, accept_traffic, proxyid src/dst, enc/dec countersA Phase 1 that is up with a Phase 2 selector that does not cover 10.20.8.40 is not “VPN is fine.” Flush one named SA only after you quote that selector, and only with rollback. IKE debug uses diagnose vpn ike log filter rem-addr4 first.
Hardware FortiGate — filtered HTTPS flow prints nothing
Live session exists. npu_state is not all zeros. Junior: “packet never hit us, add a policy.”
npu_state, then ICMP flow (not offloaded) or approved NP disablereceived a packet (or flow after offload disabled)Fortinet: flow monitoring does not work for NP6/NP7 offloaded traffic. ICMP is the safe test. diagnose npu np6 fastpath disable is temporary and change-controlled. NP7 needs the policy offload bit or the NP7 sniffer. Then stop debug.
7. After the capture
The ladder does not end when the field lights up. It ends when the original VIP works and debug is off.
| You just proved… | Safe next isolate | Change (needs control) | Not a next step |
|---|---|---|---|
| Flow Allowed + session 01 + via wrong interface | Quote details <dest> vs intended hop; check policy route / SD-WAN / static distance |
Restore the intended route; retest same 5-tuple | Clone policy 14 onto wan2 |
| Via vpn-hq, Phase 2 selector miss | Quote proxy-id src/dst from diagnose vpn tunnel list |
Fix Phase 2 selectors on a window; one named flush if required | diagnose vpn tunnel flush with no name |
| Empty HTTPS flow, npu_state set | ICMP flow or approved NP disable; then stop | Leave NP in the documented post-change state | Leave fastpath disable overnight |
| FortiView shows the hung 5-tuple | Drill Down to Details; match CLI policy_id |
End Session on that row only, then retest | End Session on the whole Top Sessions page |
VDOM / HA:     root / primary
5-tuple:       203.0.113.45:51990 -> 198.51.100.80:443 proto 6
Rung 1:        Allowed by Policy-14: SNAT ; find a route via vpn-hq
Rung 2:        proto_state=01 policy_id=14 npu_state=00000000
Rung 3:        Known via static, best, via vpn-hq, VRF=0
Rung 4:        ike gateway vpn-hq version 2 ; tunnel status=up accept_traffic=1 dpd=ok
Rung 5:        FortiView Sessions same src/dst/policy 14
Debug:         trace stop + disable + reset (GUI Stop debug flow)
Retest:        same VIP, expect proto_state=11
8. Traps + close-the-ticket proof
| Trap | You will hear | You write instead |
|---|---|---|
| Hit count = healthy | “Policy 14 is matching, so it works” | FG-CC-01: hit + proto_state=01 is a one-way handshake |
| Unfiltered flow | “Just start debug, we’ll catch it” | Filter, trace start N, stop, disable, reset |
| Empty HTTPS flow = never arrived | “Packet never hit the FortiGate” | FG-CC-03: official NP6/NP7 exception first |
| Routing from global | “get router info from this prompt is fine” | VDOMs on → enter the VDOM. Official Routing concepts note |
| Green tunnel icon | “VPN is up, must be policy” | Quote Phase 2 accept_traffic + proxy-id + enc/dec |
| Flush all | “Flush IKE, it always comes back” | Named diagnose vpn tunnel flush <name> only, with rollback |
| FortiView first | “Just End Session on Top Sessions” | CLI isolate first; End Session is Side C, one row |
| Filter clear = session clear | “Clear the filter to drop the hang” | filter clear clears the view. Session clear is impact |
- VDOM + HA role named (primary vs standby).
- 5-tuple + UTC written next to the rung you opened.
- One proof field: flow Policy-N line,
proto_state+policy_id,Known via+via, or IKE/tunnelstatus+accept_traffic. - Debug flow: filter applied,
trace start N, then stop + disable + reset (or GUI Stop). - If HTTPS flow was empty:
npu_statechecked; ICMP or approved NP disable used. - If via is IPsec: Phase 1 list + Phase 2 list, not only the dashboard icon.
- After a change: same VIP retest. Established =
proto_state=11on the intended policy and hop.
I climb a five-rung ladder: filtered debug flow, session proto_state, get router info routing-table details, diagnose vpn ike gateway list + diagnose vpn tunnel list, then FortiView Sessions for show-back. I do not add accept rules to fix a one-way handshake or a wrong next hop. I stop debug. Empty HTTPS flow makes me say NP offload out loud. Companion desk for first-tool tickets: FortiGate evidence desk.
Knowledge check
Six war-room judgments. Each maps to a rung or a proof field. Check answers. Reset and retry if you picked a dump instead of a ladder.
Sources
- FortiOS Administration Guide 8.0.0 — Debugging the packet flow (CLI
filter/filter6keys,trace start <N>/stop, FAZ/FortiCloud warning, NP6/NP7 exception, sampleAllowed by Policy-3: SNATandAllowed by Policy-2: encrypt) - FortiOS Administration Guide 8.0.0 — Using the debug flow tool (Network → Diagnostics → Debug Flow; Basic/Advanced filters; Start / Stop / Save as CSV)
- FortiOS Administration Guide 7.4.0 — Using a session table (
diagnose sys session filter/list;proto-state,policy,vd) - FortiOS Administration Guide 8.0.0 — Routing concepts (
get router info routing-table all/database/kernel/details <ip>; VDOM note; route look-up) - FortiOS Administration Guide 8.0.0 — Routing monitor (Dashboard → Network Monitor → Routing)
- FortiOS Administration Guide 8.0.0 — IPsec related diagnose commands (
diagnose vpn ike status/gateway list,diagnose vpn tunnel list/flush, IKE log filter,diagnose debug application ike -1) - FortiOS Administration Guide 8.0.0 — FortiView Sessions (Dashboard → FortiView → Sessions; Top Sessions by traffic source; end sessions)
- FortiOS Administration Guide 8.0.0 — Using FortiView (Drill Down to Details)
- FortiOS Administration Guide 8.0.0 — VPN monitor (Dashboard → Security → VPN monitor)
Related: FortiGate evidence desk · FortiGate session factory · Policies and NAT · Routing OSPF/BGP · IPsec and SSL VPN · FortiGate interview · FortiGate interview hub