A capture filter decides what is written to disk. A display filter only hides what I already have. The handshake is SYN, SYN-ACK, ACK. If I see SYN retransmits and no SYN-ACK, the listener or the path never answered — that is not TLS. Retransmits plus duplicate ACKs are loss. A high iRTT with a clean SEQ/ACK tree is latency. Zero Window is the receiver pausing me. I Follow the stream after I know which TCP conversation I own.
1. Ticket hook — ERP times out at 09:12
Finance says SAP GUI “hangs.” NOC already bounced the WAN circuit. A junior dropped Wireshark on their laptop, typed tcp.port == 3200 into the capture-filter box, hit Start, and captured nothing useful. Another junior captured every VLAN on a 10 Gb/s SPAN until the disk filled. A third opened Follow TCP Stream on the first HTTP conversation they saw and declared “the app is fine.”
That is the interview. Wireshark has two filter languages. The handshake is three packets, not a vibe. tcp.analysis.flags is how you prove loss. tcp.analysis.initial_rtt is how you prove delay. Follow Stream reconstructs application bytes — it does not invent a root cause.
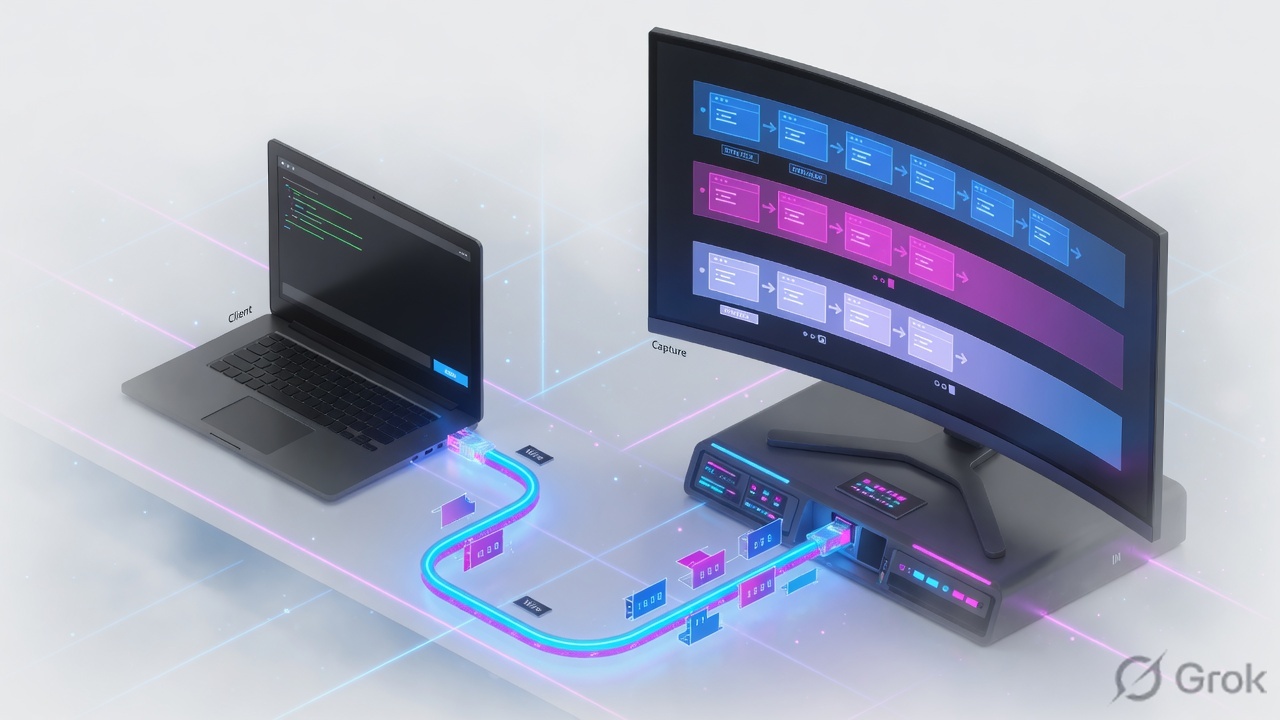
Capture filter — libpcap / BPF expression set before Start; it limits what is written to the file and cannot be widened later. Display filter — Wireshark field language; every packet stays in the file; you only change the view. 3-way handshake — SYN, SYN-ACK, ACK (RFC 9293). TCP flags — SYN, ACK, FIN, RST, PSH, URG (plus ECN bits). iRTT — tcp.analysis.initial_rtt, the handshake RTT for that flow. tcp.time_delta — time since the previous frame in the same TCP stream. Retransmission / Dup ACK — loss or reordering signals under SEQ/ACK analysis. Zero Window — receiver advertised window is 0; the sender must pause. Follow TCP Stream — Analyze → Follow; applies tcp.stream eq N and shows the reconstructed bytes. SPAN / TAP — how you see another host on a switched network.
2. Mental model: capture → decode → prove
Interviewers mix “filter,” “stream,” and “analysis flag” on purpose. Keep them on different layers. Wireshark does not create timestamps — libpcap / Npcap gets them from the kernel. It does not see traffic that never reached this NIC. It does add SEQ/ACK analysis once, in packet-list order, when the file is opened.
What the capture owns
Interface, promiscuous bit, capture filter, ring buffer, the pcapng file. Wrong place or a BPF typo means the evidence was never written. You cannot “display-filter” packets that are not on disk.
What the analyst owns
Display filter, time-display format, TCP analysis fields, Follow Stream, the sentence that says latency versus loss versus application delay. The dashboard color is not the proof.
Place the tap first. Client NIC proves what the client sent and received. Server NIC proves the other end. A mid-path SPAN or TAP proves what crossed that hop. Promiscuous mode on a switched access port still only sees that port plus broadcasts. That is why “I put Wireshark in promiscuous mode” is not a SPAN.
3. Handshake and filter decision
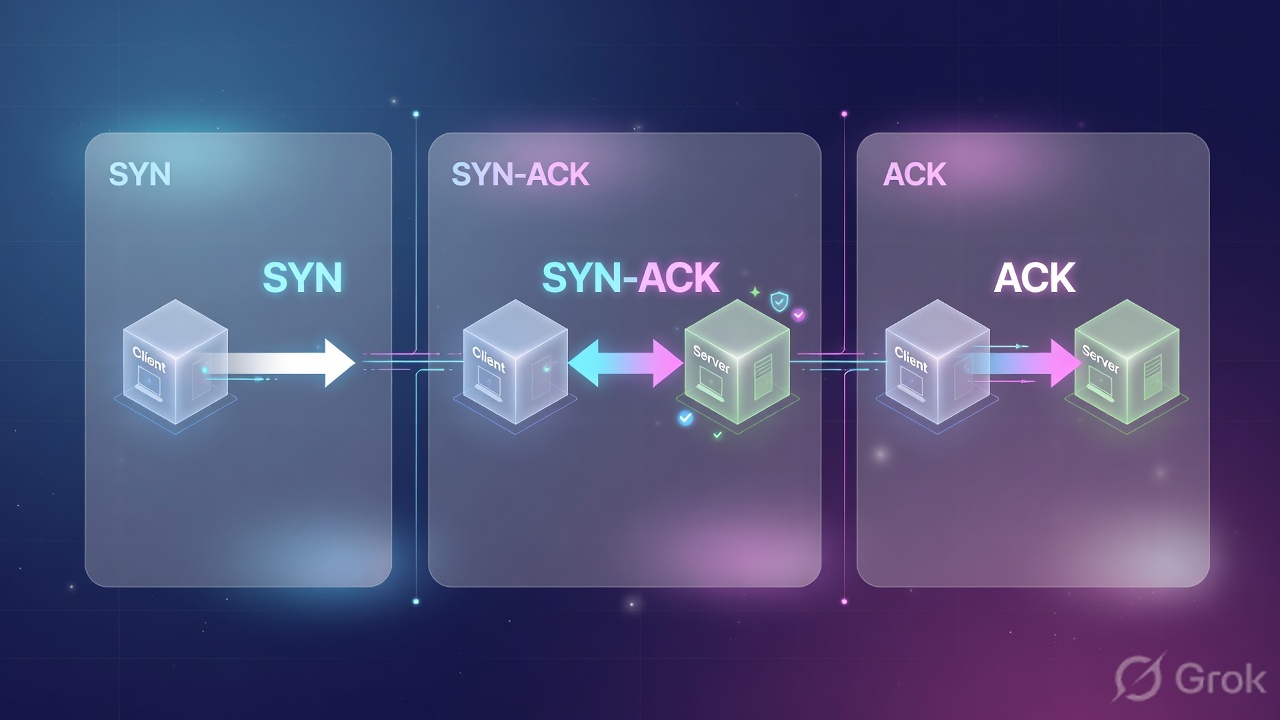
Flowchart first. You do not open Follow Stream first. You prove the conversation exists, then you decide whether you are looking at setup, flags, delay, or loss.
Read left → right, then the three outcomes. tcp.completeness==7 is SYN + SYN-ACK + ACK (1+2+4). Data, FIN, and RST add more bits. Source: Wireshark User’s Guide §7.5 and RFC 9293.
Wiki wording: tcp port 80 is a capture filter. tcp.port == 80 is a display filter. They are not interchangeable.
4. How to choose: filter, flag, latency vs loss
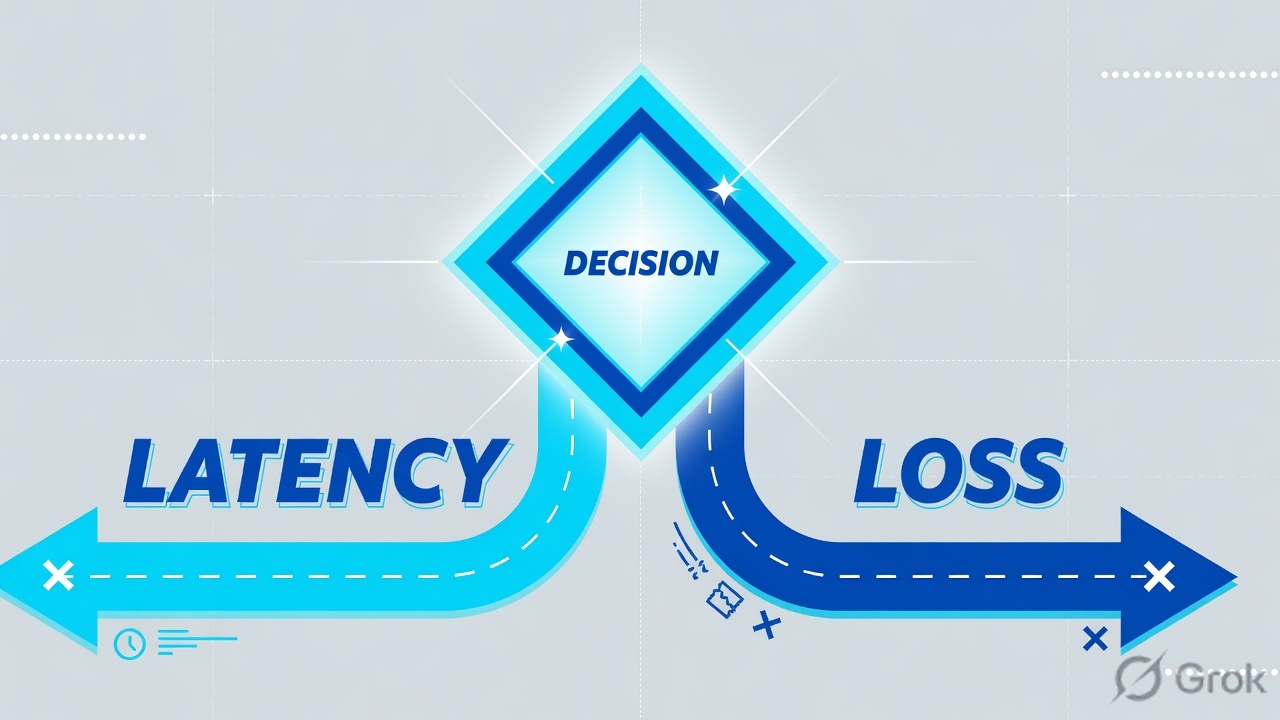
Say the language out loud. Capture filters are libpcap primitives joined with and / or / not. Display filters compare protocol fields. Mixing them is the most common fail in the room.
| Job | Use | Write this | Do not write |
|---|---|---|---|
| Keep the file small; only host 10.0.0.5 | Capture (BPF) | host 10.0.0.5 |
ip.addr == 10.0.0.5 in the capture box |
| Only TCP/443 to or from that host | Capture (BPF) | tcp port 443 and host 10.0.0.5 |
tcp.port == 443 — that is display syntax |
| Hide noise in an existing pcap | Display | tcp.port == 443 or http |
A new capture. The packets are already on disk. |
| Show only this conversation | Display / Follow | tcp.stream eq 14 (Follow applies it) |
A BPF on a file you already captured |
| Surface TCP trouble | Display | tcp.analysis.flags |
Scrolling until something is red |
| Exclude an address (display) | Display | !(ip.addr == 10.43.54.65) |
ip.addr != 10.43.54.65 — classic gotcha before 3.6 |
| What you see | Field / flag | It means | First sentence |
|---|---|---|---|
| SYN, then SYN again ~1s, 2s, 4s. No SYN-ACK. | tcp.flags.syn==1 && tcp.flags.ack==0 plus tcp.analysis.retransmission |
Handshake never completed | Listener, ACL, or path — not the application body |
| SYN, then RST | tcp.flags.reset==1 / tcp.connection.rst |
Someone aborted. Closed port or a device reset. | Who sent the RST — client, server, or middlebox |
| Handshake OK. Large gap before HTTP response. No analysis flags. | tcp.analysis.initial_rtt, tcp.time_delta, tcp.analysis.ack_rtt |
Latency or a slow server. Not loss. | Delay sits after ACK. Look at the application, not the WAN drop counters. |
| Retransmissions + duplicate ACKs | tcp.analysis.retransmission, .fast_retransmission, .duplicate_ack |
Loss or severe reordering | A segment did not arrive in order. That is a path or capture-point story. |
| Window advertised as 0, no SYN/FIN/RST | tcp.analysis.zero_window |
Receiver flow control. Sender must pause. | The receiving app or stack is full — not “the link is down.” |
| Graceful close | tcp.flags.fin==1 / tcp.connection.fin |
Orderly teardown | FIN is not RST. Do not call a FIN an abort. |
tcp.analysis.lost_segment is labeled Previous segment(s) not captured. That is common at the start of a file or when your SPAN missed a packet. It is not automatic proof that the network dropped the segment. Pair it with retransmissions on the same stream before you blame the WAN.
5. Do: place → filter → follow → classify
Primary sources for this block: Wireshark User’s Guide §4.10 (capture filters), §6.3 / wiki DisplayFilters (display), §7.2 (Follow Stream), §7.5 (TCP analysis), §7.6 (timestamps). The menu names below are from those pages.
Side A — Place the tap and write the capture filter
-
Pick the NIC that can see the symptom
Client NIC for “my session fails.” Server NIC for “nobody can connect.” SPAN or TAP for a third host on a switch. Do not capture over a USB dongle if you care about iRTT — the User’s Guide §7.6 warns USB NICs stamp late.
-
Write BPF in Capture Options, not in the display bar
Example from the guide:
tcp port 23 and host 10.0.0.5. For this ticket:host 10.20.4.88 and tcp port 443. Capture filters cannot be widened after Start. If you are unsure what you need, capture wider and display-filter later — unless the SPAN will fill the disk. -
Start, reproduce once, stop
Mark the reproduce time. Save pcapng. A 20-minute unfiltered 10 Gb/s SPAN is not a lab; it is a storage incident.
Capture / Options / Input
Capture filter (BPF)
Training mock. Field language follows User’s Guide §4.10 and wiki CaptureFilters. Example primitive shape matches tcp port 23 and host 10.0.0.5.
Side B — Display-filter the conversation, then read flags
-
Set time so deltas mean something
View → Time Display Format. For a single flow, Seconds Since Previous Displayed Packet plus the column for
tcp.time_delta(time since the previous frame in this TCP stream). iRTT lives under SEQ/ACK analysis astcp.analysis.initial_rtt. -
Prove the handshake before you blame HTTP
Display
tcp.flags.syn==1or look attcp.completeness.tcp.completeness==7is SYN + SYN-ACK + ACK only. If completeness never reaches 7, stop talking about TLS or the app. -
Turn on the analysis overlay
Display
tcp.analysis.flags. Then name the specific child: retransmission, fast retransmission, duplicate ACK, zero window, window update, previous segment not captured. Those labels are added under “SEQ/ACK analysis” (§7.5).
ip.addr == 10.20.4.88 && tcp.port == 443
tcp.flags.syn == 1 && tcp.flags.ack == 0
tcp.completeness == 7
tcp.analysis.flags
tcp.analysis.retransmission || tcp.analysis.fast_retransmission
tcp.analysis.duplicate_ack
tcp.analysis.zero_window
tcp.stream eq 14
Side C — Follow the stream, then classify
-
Select one packet in the conversation
Analyze → Follow → TCP Stream (or the packet-list context menu). Wireshark applies a display filter for that stream and opens the reconstructed bytes. Client → server is red; server → client is blue (theme colors).
-
Read the application, then decide Close vs Back
ASCII / UTF-8 for HTTP. HEX Dump for binary. Close leaves
tcp.stream eq Nin place. Back restores the previous display filter. People open Follow just to isolate the stream and immediately Close — that is documented, not a hack. -
Say the class out loud
Incomplete handshake. RST. Loss (retrans + dup ACK). Latency (high iRTT / high
tcp.time_delta, clean analysis tree). Receiver stall (Zero Window). Application error (HTTP 500 inside a healthy TCP stream). Those are different owners.
Analyze / Follow / TCP Stream 14
Reconstructed bytes
| No. | Time | Flags | Info | Analysis |
|---|---|---|---|---|
| 18 | 0.000 | SYN | 51422 → 443 seq=x | — |
| 19 | 0.042 | SYN, ACK | 443 → 51422 seq=y ack=x+1 | iRTT 42 ms |
| 20 | 0.042 | ACK | ack=y+1 | completeness=7 |
| 41 | 1.810 | PSH, ACK | HTTP GET /invoice | time_delta 1.76 s |
| 88 | 1.911 | ACK | len=0 win unchanged | Dup ACK #2 |
| 89 | 1.918 | ACK | seq rewind | Fast retransmission |
Handshake is healthy (iRTT 42 ms). The GET is late, then the path shows Dup ACK + fast retransmission. Name both. Do not pick one and ignore the other.
6. Runtime path after the pcap is open
Once the file exists, the interesting tickets are almost always wrong capture point, BPF typed in the display bar, or Follow Stream on the wrong conversation — not “Wireshark is broken.”
TCP analysis is computed once when the file opens, in packet-list order (§7.5). A later display filter does not rewrite those flags.
7. Eight interview scenarios
Each one is a production ticket. Answer with the direct line, then the evidence. Weak answers reboot the firewall, paste Expert Info, or Follow the first stream they see.
Q1 · Scenario — SYN, SYN, SYN, no SYN-ACK
Client 10.20.4.88 opens TCP/443 to 10.50.1.12. You see three SYNs about one second apart. No SYN-ACK, no RST. The app owner says “certificate problem.” What do you say first?
tcp.flags.syn==1 && tcp.flags.ack==0 and tcp.analysis.retransmission.Strong framing (say this)
I do not debug TLS on an incomplete handshake. I move the tap until I see who never sent SYN-ACK.
Evidence to name
tcp.flags.syn, tcp.flags.ack, tcp.analysis.retransmission, tcp.completeness still below 7, capture point (client vs server).
Q2 · Compare — capture filter versus display filter
You must capture only traffic to or from 10.0.0.5 overnight without filling the disk. A teammate types ip.addr == 10.0.0.5 into Capture Options. What is wrong, and what do you write instead?
host 10.0.0.5. The wiki is explicit: tcp port 80 is capture; tcp.port == 80 is display. Capture filters are set before Start and cannot be modified during the capture. Display filters only change the view; the file still holds every accepted packet.Strong framing (say this)
Capture decides what exists tomorrow. Display decides what I stare at tonight.
Evidence to name
User’s Guide §4.10 example tcp port 23 and host 10.0.0.5; wiki CaptureFilters; §6.3 “all packets remain in the capture file.”
Q3 · Evidence — which fields prove the handshake
A lead says “I see TCP, so the session is up.” What do you put in the ticket so a second analyst can replay the proof?
tcp.seq / tcp.ack (seq=x, syn-ack seq=y ack=x+1, ack=y+1). Quote tcp.completeness==7 if you want the analyzer’s summary. Name tcp.stream, both ports, and iRTT. “Protocol column says TCP” is not a handshake.tcp.port == 443.Strong framing (say this)
If I cannot point at SYN, SYN-ACK, and ACK on one stream index, I do not have a session yet.
Evidence to name
tcp.flags.syn, tcp.flags.ack, tcp.seq, tcp.ack, tcp.completeness (1+2+4=7), tcp.stream, tcp.analysis.initial_rtt.
Q4 · Troubleshoot — latency versus loss
Users say the portal is slow. Capture at the client shows iRTT 38 ms, then a 1.8 s gap before the HTTP response, then later a burst of duplicate ACKs and a fast retransmission. A junior wants to “tune the WAN QoS.” First check?
tcp.analysis.flags is delay — server think time or an upstream hop, not a drop. The later Dup ACK + tcp.analysis.fast_retransmission is loss or reordering on that stretch. They can both be true. Do not treat iRTT as the page-load time, and do not treat one retransmit as the 1.8 s stall.Strong framing (say this)
I name the quiet gap and the loss flags as two findings. iRTT is the handshake, not the GET.
Evidence to name
tcp.analysis.initial_rtt, tcp.time_delta, tcp.analysis.ack_rtt, tcp.analysis.duplicate_ack, tcp.analysis.fast_retransmission.
Q5 · Architecture — draw the handshake and the tap
“Walk the packets from the client click until you have a pcap we can trust.” They want order and a capture point, not a product tour.
Strong framing (say this)
SYN, SYN-ACK, ACK. I can point at the hop that should have copied those frames.
Evidence to name
RFC 9293 handshake; SPAN/TAP vs access port; §4.10 BPF; §7.5 analysis-once; §7.6 USB timestamp warning.
Q6 · Troubleshoot — Follow Stream on an HTTP 500
Handshake is complete. iRTT 12 ms. No retransmits. The user still sees an error. A teammate is already graphing TCP throughput. What do you do first?
tcp.stream. Read the ASCII: request line, status code, server header. An HTTP 500 on a healthy TCP session is an application ticket. Close leaves the stream filter on so you can jump back to the packets that carried the body. If the payload is TLS and you do not have keys, say so — Follow will not decrypt it for you (wiki TLS).Strong framing (say this)
TCP already did its job. I Follow, I quote the status line, I hand it to the app owner.
Evidence to name
Analyze → Follow → TCP Stream; tcp.stream eq N; Close vs Back; client red / server blue; HTTP status in ASCII.
Q7 · Compare — RST versus FIN versus Zero Window
Three pcaps land on your desk. A: server sends RST after the GET. B: both sides exchange FIN. C: server packets show window 0, then a window update two seconds later. A junior calls all three “the connection dropped.” Separate them.
tcp.flags.reset / tcp.connection.rst) aborts — closed port, application reset, or a middlebox. FIN is an orderly close. Zero Window (tcp.analysis.zero_window) is flow control: the receiver advertised it cannot take more data; the sender must pause until a window update. The User’s Guide even notes a printer pausing a job as a normal Zero Window.Strong framing (say this)
RST aborts. FIN finishes. Zero Window asks me to wait. I say which IP set the bit.
Evidence to name
tcp.flags.reset, tcp.flags.fin, tcp.analysis.zero_window, tcp.analysis.window_update, tcp.window_size == 0 && tcp.flags.reset != 1.
Q8 · Unsafe shortcut — capture the whole SPAN, decrypt later
Someone enables a 10 Gb/s SPAN to their laptop, no BPF, “we will display-filter in the morning,” and asks for the production TLS private key so Follow Stream is readable. What do you undo?
host … and tcp port …). Ring-buffer the file if the window must stay wide. Do not copy a production private key onto an analyst laptop — that is a key-compromise ticket, not a pcap trick. If TLS visibility is required, use an approved decrypt point or session keys the client already exported, following the wiki TLS process. Hunt the overnight file only if the disk survived; otherwise the evidence is gone.Strong framing (say this)
I filter on the way in. I decrypt only with an approved key path. I do not steal the certificate’s private key to pass an interview demo.
Evidence to name
§4.10 capture filter; ring buffer / multiple files; wiki TLS key log; who owns the cert private key.
8. Traps and proof checklist
| Trap | What you see | Safer next step |
|---|---|---|
| Display syntax in the capture box | tcp.port == 443 rejected or captures nothing |
Write tcp port 443 (BPF) |
| Promiscuous = whole VLAN | Only your host plus broadcasts | Ask for SPAN or a TAP |
| TLS debug on SYN-only | Retransmitted SYNs, completeness < 7 | Fix listener / path first |
| Any Expert red = loss | Keep-alives, out-of-order, “previous segment not captured” | Name the specific tcp.analysis.* child |
| iRTT used as page load | Handshake 40 ms, GET sits 2 s | Use tcp.time_delta on the data packets |
| Zero Window called a drop | tcp.analysis.zero_window |
Receiver buffer; wait for window update |
| RST = “the firewall” | RST sourced from the client or the app | Check which IP set tcp.flags.reset |
| Follow stream 0 | Wrong conversation, “app looks fine” | Match 5-tuple, then Follow |
| Back instead of Close | Stream filter disappears | Close keeps tcp.stream eq N |
| USB NIC for timing | Fantasy iRTT | §7.6: do not use USB when you need accurate stamps |
| Unfiltered 10G SPAN | Disk full, missed the window | BPF + ring buffer |
ip.addr != x as “not this host” |
Almost everything still matches | !(ip.addr == x) |
- Capture point named (client NIC / server NIC / SPAN / TAP) and why promiscuous was not enough.
- Capture filter is BPF (
host,tcp port); display filter is Wireshark fields. - Handshake spoken as SYN → SYN-ACK → ACK, or explicitly incomplete / RST.
- Stream index quoted (
tcp.stream) before Follow. - Latency vs loss split: iRTT /
tcp.time_deltaversus retransmission + duplicate ACK. - Zero Window, FIN, and RST not collapsed into “it dropped.”
Knowledge check
Six judgment items. Each maps to a promise bullet. Check answers, then reset and re-read the traps table if you miss any.
Sources
- Wireshark User’s Guide §4.10 — Filtering while capturing (libpcap / BPF;
tcp port 23 and host 10.0.0.5) - Wireshark Wiki — CaptureFilters (capture is not a display filter;
host 172.18.5.4) - pcap-filter man page — capture-filter primitives and TCP flag bytes
- Wireshark User’s Guide §6.3 — Filtering packets while viewing (file contents unchanged)
- Wireshark User’s Guide §6.4 — Building display filter expressions
- Wireshark Wiki — DisplayFilters (
tcp.port == 80; Zero Window example;ip.addrgotcha) - wireshark-filter(4) — display filter language
- Display Filter Reference — Transmission Control Protocol (
tcp.flags.*,tcp.analysis.*,tcp.stream,tcp.completeness,tcp.time_delta) - Wireshark User’s Guide §7.2 — Following protocol streams (filter, colors, Close vs Back)
- Wireshark User’s Guide §7.5 — TCP analysis (retransmission, Dup ACK, Zero Window, completeness bits)
- Wireshark User’s Guide §7.6 — Time stamps (from libpcap/OS; USB NIC warning)
- RFC 9293 — TCP (3-way handshake and flags)
Related: SOC analyst interview · Linux interview · CCNA interview · VAPT interview · Interview hub